

Nicoz Diamond (Zim) Results Analysis FY2016
Key Highlights
o Gross premium written up 2% from $28.9m in 2015 to $29.6m in 2016
o Earned Premium up 9% from $17.7m in 2015 to $19.3m in 2016
o Claims up 13% from $11.2m in 2015 to $12.7m in 2016
o Total costs up 3% from $17.2m in 2015 to $17.8m 2016
o PAT up 1.3% from $0.1m in 2015 to $1.7m in 2016
Operating Income Composition ($m)
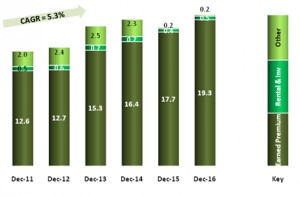
o Gross written premium at $29.6m was 2% higher than the 2015 level. Net earned premium has continued to grow and Nicoz Diamond has a 23% market share among non-life insurers.
o In terms of income lines, the non-life insurer is less diversified as seen by the strong dominance of earned premium. Contribution of rental and investment income as well as other incomes has waned over the years.
Total Operating Costs Composition ($m)
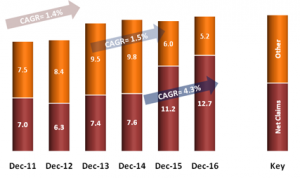
o A 13% increase in net claims pushed up operating costs by 3% from 2015 level of $17.2m to $17.8m in 2016.
o The company managed to control other operating costs (admin costs, employment related costs etc), which it has direct control over, dropping by 14% to $5.2m from $6.0m in 2015.
o Increase in net claims was a result of increase in prices of motor spares as result of import restrictions and other underlying macroeconomic challenges.
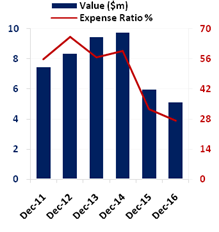
Costs Trends

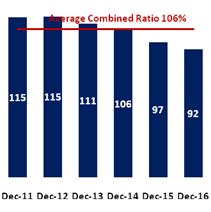
o With a combined ratio of 92%, it implies that Nicoz Diamond has an underwriting margin of 8%. However, over the 6-year period, the company has a combined ratio of 106% implying an underwriting loss of 6%.
o Commendably, Nicoz Diamond managed to lower its operating expenses to help balance a sharp increase in claims and acquisition costs.
Profitability Trend (PAT $m)

o The company has recovered from a shock drop in profits in 2015 to manage a sharp growth to $1.7m from $0.1m in 2015.
o Nicoz is be positioned to sustain its profitability. Continuous improvement in efficiency and convenience driven by ICT will preserve costs contributing more to the bottom line.
5-YEAR Balance Sheet Analysis ($m)
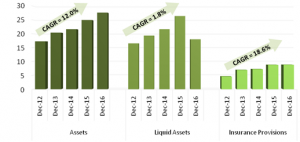
o Total assets have continued to grow driven by an increase in premium debtors. The company has a 14% market share in terms of assets among non-life insurers.
o Despite a fall in liquid assets in 2016, Nicoz Diamond has managed to grow its liquid assets at an annual average of 1.8% over the 5-year period.
o The company is well capitalized with its capital above the $2.5 million proposed regulatory minimum.
Nicoz Diamond Key Indicators
| 2011 | 2012 | 2013 | 2014 | 2015 | 2016 | |
| Expense Ratio % | 55.8 | 66.2 | 56.7 | 59.8 | 32.6 | 27.2 |
| Claims (loss) Ratio % | 55.8 | 49.8 | 48.5 | 46.3 | 63.4 | 65.4 |
| Combined Ratio % | 115 | 115 | 111 | 106 | 97 | 92 |
| Current Ratio % | 144.0 | 152.6 | 144.3 | 157.4 | 133.7 | 93.4 |
| Capital to liability Ratio % | 100.0 | 107.7 | 91.3 | 100.1 | 75.3 | 82.0 |
| Debt to Equity Ratio % | – | 2.60 | 1.99 | 1.37 | 0.89 | – |
| Underwriting margin % | (15.2) | (15.5) | (10.5) | (5.8) | 2.7 | 7.9 |
| Return on Revenue % | 3.2 | 7.7 | 6.0 | 7.3 | 0.7 | 8.6 |
| Return on Assets % | 3.1 | 7.3 | 5.9 | 6.8 | 0.5 | 6.6 |
| Return on Equity % | 6.1 | 14.3 | 11.8 | 13.9 | 1.1 | 14.9 |
Our View
Nicoz Diamond has a healthy underwriting margin of 7.9% and the company has been profitable over the past 6 years although the earnings have been volatile. Over the years the company has been able to curtail its costs in response to the adverse operating environment. A return on equity of 15% and a return on assets of 7% is healthy, this given the tight operating environment and the competitive nature of the non-life insurance industry. However, rising claims are a major area of concern and the phenomena is market-wide speaking in part to a deteriorating quality of business underwritten. Continuous monitoring and managing of claims and responsive market solutions will help the company to sustain its earnings. Overall, the 2016 performance buttressed by a cost containment drive was fair, given the tight operating environment.


